This web page was produced as an assignment for a course on
Statistical Analysis on Microarray Data at
#################################### MA PLOTS
I weighted all the genes as either 0 or 1. A weight of 1 corresponds to meeting all of the following requirements:
1) there are at least X% of the foreground pixel intensities > mean(background pixels intensity) + 1*sd(background pixel intensity).
I set X=0 – so that makes this condition moot. On array 11, no gene satisfied this condition for X=5.
2) the gene is not autoflagged
3) the median foreground intensity is greater than 30 for either green or red
I had to set this down to 30 because many of the genes distinctly show up with this low of a setting on some arrays.
Unfortunately, this value is too low and therefore inappropriate for the bad arrays (see interesting things about the dataset).
4) the gene is not spot flagged
5) the gene is not a control
I created plots to compare each of the 34 microarrays’ raw data to background subtracted data and loess normalized data.
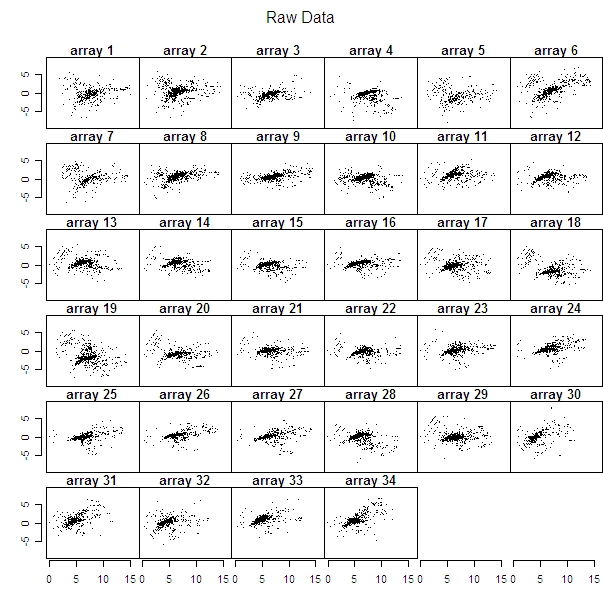
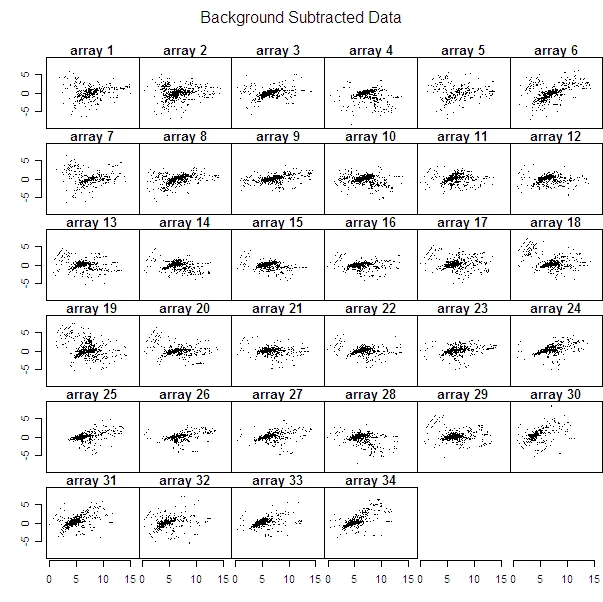

To see some arrays where there were obvious differences between the original data and the corrected data look at arrays 6 or 34 (it’s increasing in both the raw and the background subtracted data of these two arrays, but corrected in the loess one). But then arrays 21 and 22 are practically the same in the raw data as in the corrected data.
####################################################################### FOREGROUND & BACKGROUND INTENSITIES


Kolmogorov-Smirnov test of normality for each of the 1536 genes resulted in the p-values seen in the histogram below.
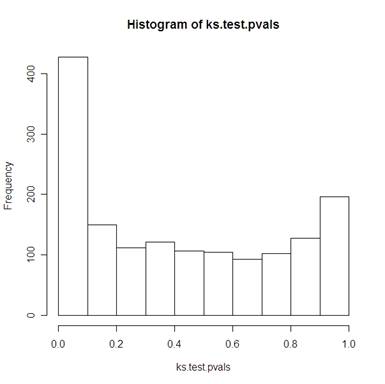
1109 of the 1536 genes had a p-value greater than 0.1 (in other words: for alpha=0.1, for 72% of the individual genes, there is not enough evidence to suggest that the distribution is not normal).
So this seems to have done a decent job of normalizing the data, but not a great one.
Using a Looney Gulledge test for normality (Using John Kloke’s looney function – link to Kloke’s site – link to Kloke’s math 158 spring 2006)
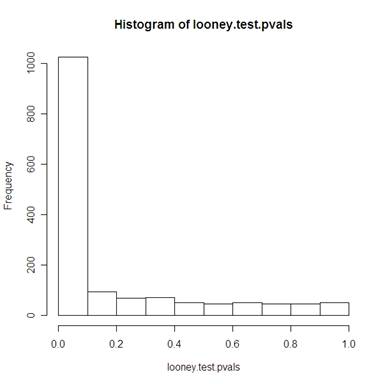
512 of the 1536 genes had a p-value greater than 0.1 (in other words, for alpha=.1, for 67% of the data, we reject the assumption that the data is normally distributed).
This test also suggests that the normalization is not great.
This website was designed by Austen Head.
Email: austen
[dot] head [at]