GENETIC REGULATION IN EUKARYOTES, POMONA COLLEGE, 2005 PROJECT:
Petite and malonate-inhibited yeast gene expression.
This project is an investigation of the gene expression patterns in wild type yeast, wild type yeast inhibited with malonate (an inhibitor of the TCA cycle Succinate Dehydrogenase enzymes) and yeast selected to be petite. Petites have lost some or all of the mitochondrial genome encoding essential components of the electron transport machinery of the mitochondria, and have major changes in gene expression under some culture conditions(Epstein et al, Mol Biol of the Cell 12:297-305, 2001). The class experiment explored gene expression in these conditions using glucose as the carbon source, unlike Epstein et al.. We also hoped to study petites treated with malonate, for which little data were obtained due to a failure of amplification of RNA for the microarrays. We began by isolating a new petite by growing the wild type cells on Ethidium Bromide plates. Then we conducted growth curves for wild type and petite with and without various concentrations of malonate to pick the concentration to use. Finally, we grew the strain and froze pellets for RNA preparation. For each condition, the class performed RNA isolation and quality control, used an Ambion kit to make double stranded cDNA while attaching a T7 promoter, amplify the mRNA using an activated amino allyl derivative of one nucleotide, and then couple the amplified RNA to Cy3 or Cy5. Then they hybridized GCAT arrays printed at WU, using both dye/sample combinations, in DigEasy hybridization buffer as described for the GCAT workshops on the GCAT website, at 37 degrees fro 15 hours, and washed as described. The data were obtained by scanning with an Axon GenePix scanner at Pomona College. The students analyzed the data using GenePix software for spot fitting and for quality control and GeneSpring for clustering and ANOVA. We also ran RT PCR of two genes the class picked from the array data to see if we could verify our results.
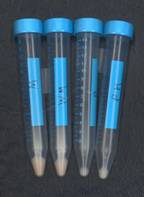
The students started with growth curves and harvested the four types of cells late in log phase. The pellets from which RNA was prepared are shown in this picture. They found these results interesting, considering their initial hypothesis that malonate inhibition and petite would similarly affect gene expression. As you can probably see, the left wild type pellet is largest, followed by the wild type malonate (WM). The third from the left, petite (P) is smallest, and if anything, the petite malonate (PM) is larger than petite, certainly not smaller. These results imply that malonate (TCA cycle inhibition) inhibits the growth of the wild type but not the growth of the petite.
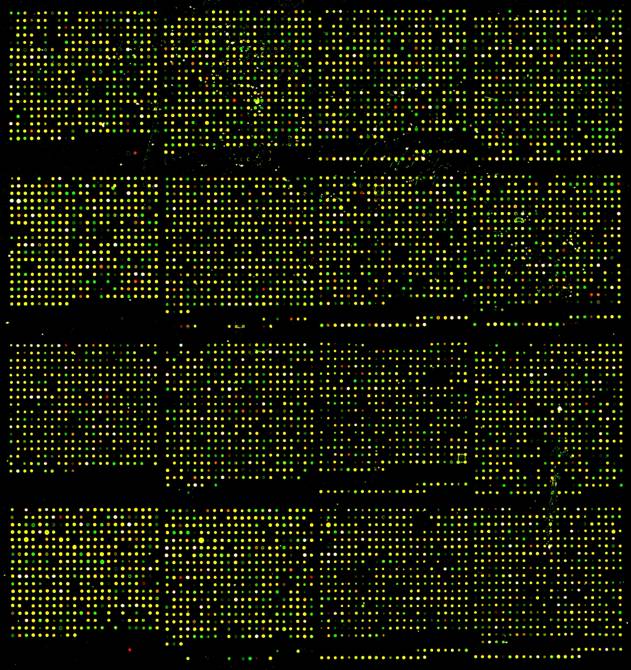
The students prepared RNA from the frozen pellets via grinding with glass beads and using a Qiagen RNEasy kit including the optional DNase treatment. They found there was a lot of high molecular weight RNA present and almost no genomic DNA, and that their A260/A280 ratios were greater than 1.8, so they were certified to proceed to array preparation. They used the Ambion aRNA procedure to prepare multiple copies of the mRNA present, and then coupled the aRNA to Cy3 or Cy5. On one array, they hybridized Cy3 wild type/Cy5 malonate wild type on one end and Cy5 wild type/Cy3 malonate wild type on the other end. On the other array, they hybridized Cy3 wild type and Cy5 petite and on the other end, Cy5 wild type and Cy3 petite. The RNA from petite malonate was judged usable, but no aRNA was recovered due to an accidental change in the elution procedure by one of the students. The picture below shows the top array from slide 111, which contained the wild type with Cy3 (green fluorescence) and wild type with malonate with Cy5 (red fluorescence).
This was the first year that the Bio164 lab groups had used amplification of mRNA in preparing arrays. Over summer, 2005, the Hoopes lab researchers had found that the total RNA arrays, even when they passed the GenePix quality control standards, produced data that could not be substantiated with real time RT PCR reactions, while those from the aRNA hybridizations agreed well with the RT PCR results. So, although the procedure is much more complex, LH decided to have the class use this method.
The students got a gpr file for each array, and they imported the ratio of medians into an Excel spreadsheet that is available for educational purposes upon request (lhoopes@pomona.edu).
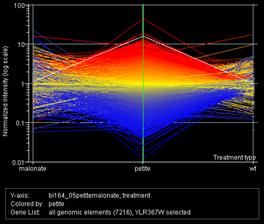
GeneSpring released their software to the class free of charge for their data analysis, and this graph shows the overall gene expression pattern the class obtained, with a set of wild type/wild type data for comparison. Within each graph, the wild type with malonate/wild type array is on the left, the petite/wild type in the center, and the wild type/wild type on the right. In the left graph, the white line highlights RPS22B, one of many ribosomal protein genes that followed similar patterns in the data. In the right graph, the white line highlights PCK1, encoding phospho enol pyruvate carboxykinase, a key enzyme in gluconeogenesis. In their discussions, the students highlighted the shortage of ATP with no electron transport, leading to a decreased anabolic pathway to glucose/glycogen in petites. They thought, based on the genes expressed, that fatty acid oxidation could take up the slack in the malonate cells but not in the petites. The petites have an NADH burden and no easy way to get rid of it, and they lack electron transport carriers for beta oxidation of fatty acids, so they are reduced to running fermentation (glycolysis with an end reaction to regenerate the NAD+).
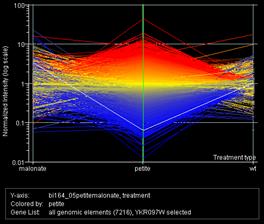
The students clustered the data in GeneSpring. Some groups showed similar regulation in both situations, and others did not. An example of clustering is shown below. The cluster shown was identified as rich in carbohydrate metabolism and energy production pathway genes. The results make sense in that these pathways are down regulated in petites since they must rely on fermentation/glycolysis, lacking electron transport, while the malonate inhibited cells could do almost all of metabolism, including ATP generation and NAD regeneration using fats. They could use the glyoxylate cycle and amino acid breakdown to get the substrates they need that are usually provided from the TCA and associated anaplerotic pathways. Thus, their energy and carbohydrate metabolism pathways are not downregulated as in the petites, because their energy situation is very different and allows them to accomplish most of what could ordinarily be done by the TCA cycle by using alternative pathways.
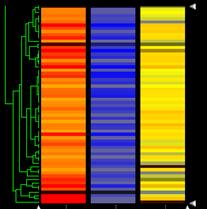
In the Figure, you can find the data on one individual gene on each line. In the malonate inhibited cells on the left, upregulation occurs for the genes that are strongly downregulated in the petites (central). In the wild type/wild type, no changes are seen (right). The green network on the left side shows the hierarchical clusters the program constructed from this group of genes, and lists of the genes in each cluster can be obtained. The genes in this cluster included many from central carbohydrate metabolism including the TCA cycle, electron transport, and oxidative phosphorylation. The students used these lists to think about what was happening metabolically.
Finally, the students selected two genes to verify by real time RT PCR using the ABI Prism and the SYBR Green method which measures the entire increase in DNA during the PCR reaction. To perform this reaction quantitatively, they designed and used primers wiht a high melting temperature and low primer dimer likelihood, specific to the mRNA of interest, capable of PCR to create a DNA fragment of about 100 bp. The two genes they tested were PCK1 and RPS22B, shown in the microarray data above by the white lines.
As tabulated by the student Amy Rapp, here are the comparative data for the real time RT PCR and the average of the pair of microarrays for each condition, having the microarray data corrected for the dye inversions.
Experiment: Ratio of treated over wild type:
Treatment Gene Microarray qRT PCR
Malonate PCK1 7.0 91.12
Petite PCK1 0.07 0.05
Petite malonate PCK1 - 0.083
Malonate RPS22B 1.5 2.5
Petite RPS22B 15 168.97
Petite malonate RPS22B - 1000.3
The students cited a variety of evidence in trying to explain these data, in which the up and down patterns were replicated between the two techniques. They noted that the petites seemed to be experiencing a much more restricted phenotype, probably because they could not use beta oxidation of fats but had to rely upon glycolysis/fermentation to get ATP. The malonate inhibition would still allow the cell to get lots of ATP from fat breakdown, they argued. Some of them suggested that the literature showed that cells which were grown on xylose had upregulated PCK1, so use of alternative carbohydrates in the malonate treated cells could be occurring.
The up regulation of the ribosomal proteins, including RPS22B, especially in petites, seemed counterintuitive since little ATP would be available for making more proteins. Some noted that in stress, almost all of the ribosomal protein genes are downregulated (Gasch, A et al, 2000, Mol Biol Cell 11:4241) and so this finding seemed to suggest that the petites were not under stress. However, it was hard to explain why a complete lack of availability of the electron transport/oxidative phosphorylation pathways would not constitute some form of a stress to the cells, although almost all yeast do use the glycolysis/fermentation pathway early in growth until the diauxic shift near the onset of stationary phase (DeRisi et al, 1997, Science 278:680). One student cited Martinez et al, 2004, Mol Biol Cell 15:5295 who showed that if cells enter stationary phase, a strong upregulation of the ribosomal protein genes could be found very rapidly (within 5 minutes) after refeeding. He suggested that these cells had perhaps shifted into pathways reusing nutrients and thus were experiencing a refeeding-like phenomenon. The cAMP dependent protein kinase, which upregulates the ribosome regulon, was also suggested as a potential cause of this unexpected increase in ribosomal protein gene expression (Warner, J, 1999, Trends Biochm Sci 24:437). A third hypothesis was that the petites never undergo the diauxic shift that would downregulate the ribosome regulons, since they are incapable of electron transport and oxidative phosphorylation.
A priori, the students all predicted that malonate would have very little effect on petite cells. It is too bad after all that we could not get microarray data on this cell type, because we could have seen more about what genes were up regulated under these conditions and perhaps made more sense of this state.
One of the most interesting follow up experiments suggested by the students was to study the events in cells with disruptions in the protein kinase A pathway, to see if the ribosome regulon would respond as predicted.