This web page was produced as an assignment for a course on
Statistical Analysis on Microarray Data at
PAM Classification to distinguish between all arrays. (PAM Classification to distinguish between normal and tumor below)
Plotcv
This compares the misclassification of arrays (as a percentage on the y axis) to the number of miRNA that we look at (top x axis).
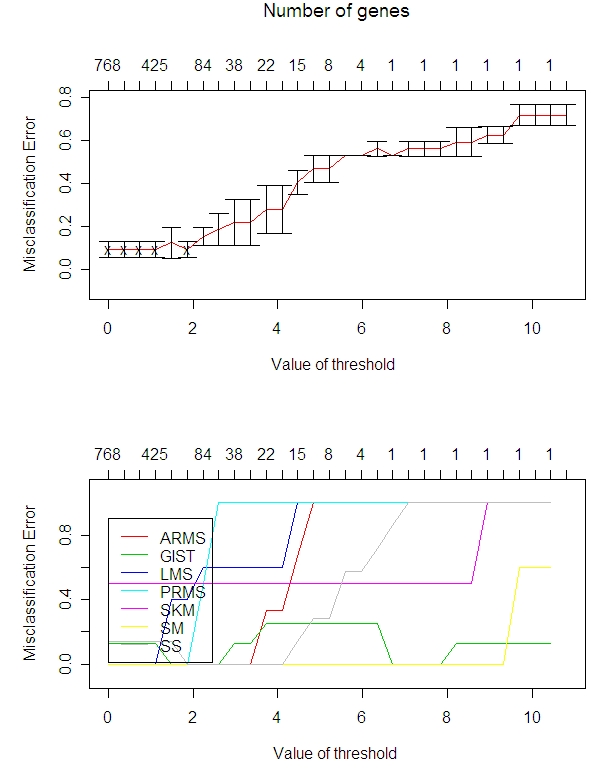
I set the threshold at 1.9 for everything after this since this is the largest threshold that minimizes the misclassification error. Note that this does not include ERMS or DDLPS because these types only had 1 array each. Look at the yellow line (SM) and the purple line (SKM): these are the normal tissue types. It would be good to differentiate these from the tumor types, but looking at the left hand side of the graph immediately above, the SKM is at 0.5 misclassification error. That means even keeping all the miRNA, half of the SKM (of which there are only 2) are misclassified.
(SKM and SM are the normal tissues; the others are all tumors tissue.)
Confusion
Matrix
threshold?1: 1.9
Read
1 item
ARMS GIST LMS PRMS SKM SM SS Class Error
rate
ARMS 3
0 0 0 0 0 0 0.0
GIST 0
8 0 0 0 0 0 0.0
LMS 0
3 2 0 0 0 0 0.6
PRMS 0 0 0 1 0 0 1
0.5
SKM 1
0 0 0 1 0
0
0.5
SM 0
0 0 0 0 5
0 0.0
SS 0
0 0 0 0 0 7
0.0
Overall
error rate= 0.149
It looks like the main problems are with LMS. Then also 1 (of 2) PRMS and 1 (of 2) SKM are misclassified. One SKM normal tissue is classified as a SS tumor tissue which is not good.
(SKM and SM are the normal tissues; the others are all tumors tissue.)
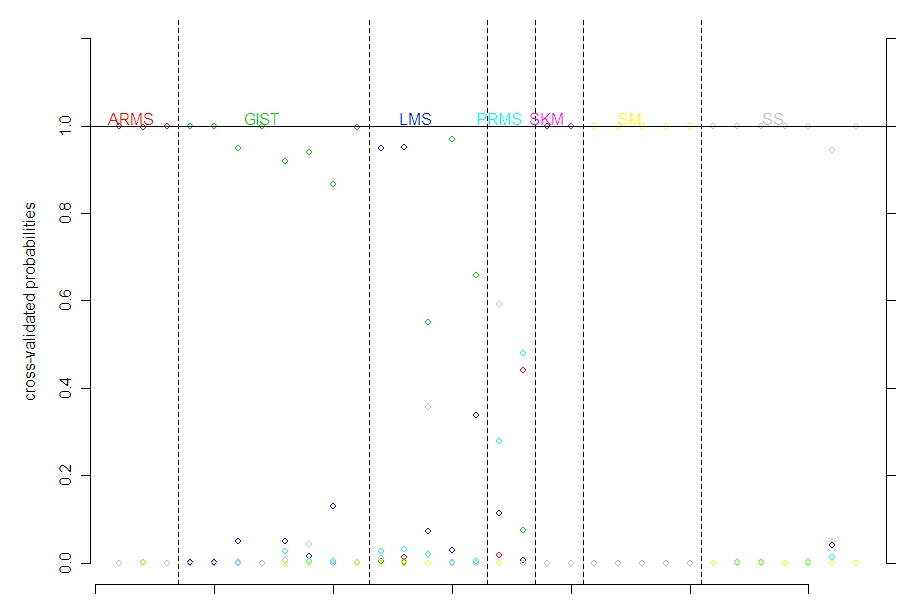
Note that one of the SKM is wrong nearly 100% of the time as an ARMS (it is hard to see the difference between red and purple, but you can look at the confusion matrix above).
A list of the genes that were used with a threshold of 1.9
id ARMS-score GIST-score LMS-score
PRMS-score SKM-score SM-score SS-score
[1,] 570 0 0.0169 0
0
0
-3.6601 0.4807
[2,] 185 1.1001 -0.4613
0 0 2.8071 -0.5356 0
[3,] 755 0.6234 -0.3064
0 0 2.3107 0
0
[4,] 699 0.7767 -0.0229
0 0 2.2609 -0.2934 -0.2013
[5,] 561 1.5033 -0.2233
-0.0901 0.9265 2.1697
-0.82 0
[6,] 259 0 -0.0034 -0.2143
0 0 1.7958 0
[7,] 509 0 0 0 0 0 -1.7289 0
[8,] 359 0.2121 -0.1627
0 0 1.7002 0
0
[9,] 489 -0.2543 0.1578
0 -0.2861 0
1.6591 -0.7074
[10,] 295 -0.2405 0.2608
0 -0.6511 0
1.3774 -0.778
[11,] 667 0 0 -0.4835 0
0
1.3345 0
[12,] 688 0 -0.3749 -0.2794
0 0
1.2391 0
[13,] 728 0 0 0 0 1.2277 -0.0386 0
[14,] 27 -0.9695 0.7115
0 0 0 0.02 -1.1298
[15,] 452 1.1131 0
0
0
0
0 -0.0969
[16,] 555 0 0 0.0486 0
0
-1.0855 0
[17,] 187 0 0 0 0 1.0344 0
0
[18,] 101 -0.6862 0
0
0
0
0
0.9827
[19,] 8
0 0 0 0 0.2716 -0.9544 0
[20,] 701 0 0 0 0 0.904 -0.0379 0
[21,] 377 -0.25 0.8869
0 0 0 0 -0.1721
[22,] 536 0 0 0 0 0 -0.795 0
[23,] 255 0 0 0 0 0 0 0.7911
[24,] 337 -0.1196 0.7718
0 0 0 0 -0.1441
[25,] 683 0 0 0 0 -0.7587 0
0
.
.
.
[137,]
326 0 0 0 0 0 0 -0.0028
Several of these miRNA are interesting (especially the top one with id 570). See the miRNA list in the next section with normal vs tumor for an explanation. I am not going to go into analysis for these since there are so many of them.
##############################################################################################
Comparing
Plotcv
This compares the misclassification of arrays (as a percentage on the y axis) to the number of miRNA that we look at (top x axis).
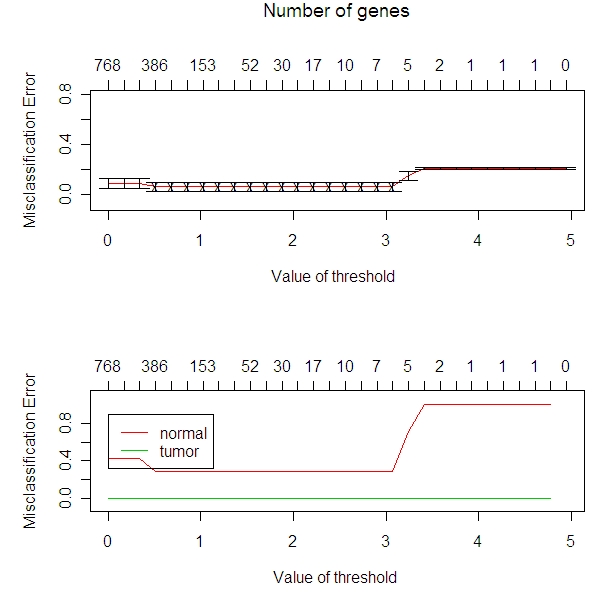
I am going to use a threshold of 2.8 because I am wan to work with as few miRNA as possible to still be useful.
Confusion Matrix
Read
1 item
normal tumor
Class Error rate
normal 5 2
0.2857143
tumor 0 27
0.0000000
Overall
error rate= 0.058
This shows that the miRNA are able to classify a tumor as a tumor, but are not as good at classifying normal tissue as normal.
Significant miRNA
id normal-score tumor-score
[1,]
570 -0.6572 0.1704
[2,]
259 0.2046 -0.053
[3,]
667 0.1722 -0.0446
[4,]
688 0.1514 -0.0392
[5,]
509 -0.1078 0.0279
Look at SAM for comparing between normals and tumors (the first part): 570 is 35th, 259 is 36th, 667 is 27th, 688 is 8th, 509 is 31st.
And for SAM comparing between all types (the second part): the top miRNA is 570. 509 is 2nd, 259 is 6th, 667 is 24th, 688 is 17th.
That is neat that the miRNA that help classify the tissue types for PAM classification between normal and tumor were the same miRNA that were found to be significant by SAM.
######################################################################################
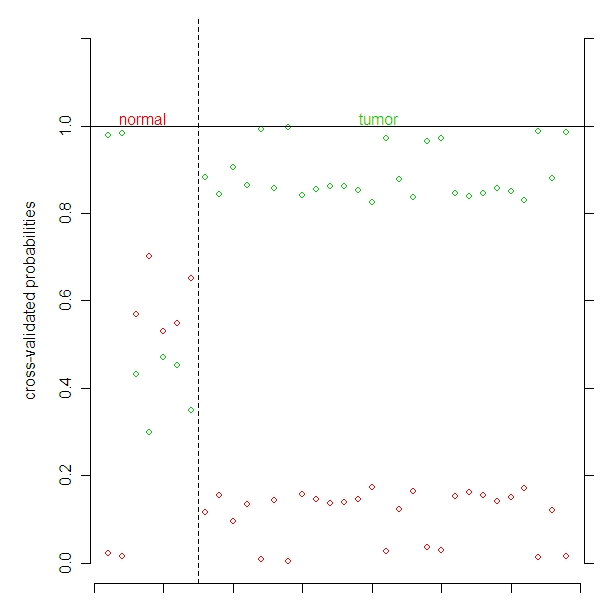
Comparing the PAM classification of all types of tissue to the classification of normal vs tumor tissue provides some more interesting information. For example, when comparing all the tissue types together there was not much of a problem of misclassification in terms of normals and tumors being confused (except the one normal SKM identified as a tumor ARMS) whereas looking at the cross-validated probability graph for just normal and tumor we see that the normals and tumors are more likely to get mixed up. This is largely due to the fact that there are far fewer miRNA needed to differentiate the normal and tumor genes than to differentiate between all the tissue types. But it is interesting that the error with just the normal and tumor is both normals wrongly classified as tumors whereas with all types there is a normal classified as a tumor and a tumor classified as a different kind of tumor.
This website was designed by Austen Head.
Email: austen [dot] head [at]