|
HOME | DESIGN | MICROARRAY SAMPLES | NORMALIZATION | SIGNIFICANCE TESTING | SAM | H. CLUSTERING | PAM CLUSTERING | PAM CLASSIFICATION | CONCLUSIONS |

This web page was produced as an assignment for a course on Statistical
Analysis of Microarray Data at
PAM Classification:
In our example, PAM Classification makes intuitive sense when considering all
of the tumor types investigates. This is because in a diagnostic setting,
one will be classifying an unknown tumor against a variety of alternatives.
Thus, we performed our PAM classification using all 7 tumor types and 2
normal tissue types. However, two tumor types needed to be removed
because they only had one array each.
Below is a plot of the misclassification error rate as a function of the value
of the threshold used in the PAM algorithm. The values along the top of
the plot are the number of miRNAs that are included in the analysis (that is,
that aren't thrown out because of the threshold value). The bottom plot
shows the misclassification error rate for all of the seven groups we examined.
The top plot shows the weighted average misclassification error rate.
Note that the X in this plot marks the spot at which the total error is
lowest.
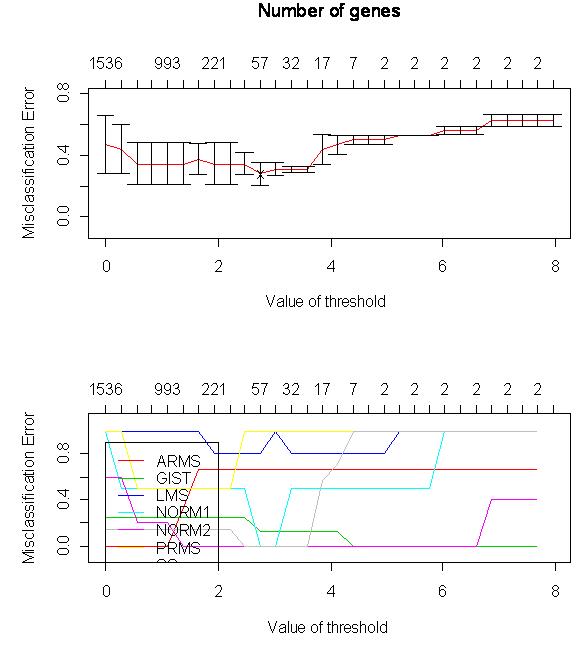
After examining this, an optimal threshold value of about 2.5 was determined.
Note that this includes 57 miRNAs, a good amount considering that our initial
filtering found that only 87 were valid for analysis.
A confusion table was then created using this threshold value. Confusion
tables show the true classification versus the classification found using PAM
so that one can analyze the accuracy of the method. Below is the
confusion table. The labels along the vertical axis are the true
classifications, and the labels along the horizontal axis are the
classifications found using PAM.
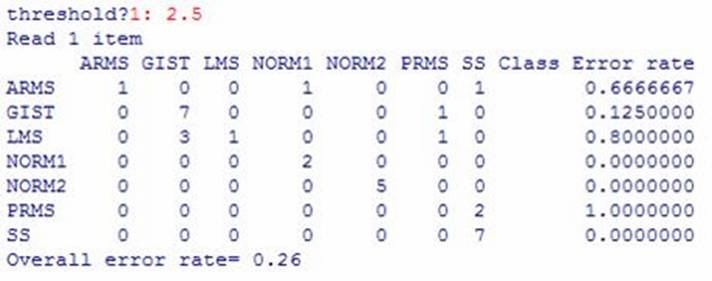
There are some notable conclusions from this table. First of all, several
tissues are always classified correctly: SS, NORM1, NORM2. GIST is
almost always classified correctly. Of note is the fact that none of the
PAM classifications were totally correct. The overall error rate is 0.26,
which is relatively low (1 in 4 will be classified incorrectly).
Finally, we looked briefly at the expression plots for one miRNA (both
duplicates shown). Note that this was an miRNA that was found to be most
significant between all seven groups using SAM.
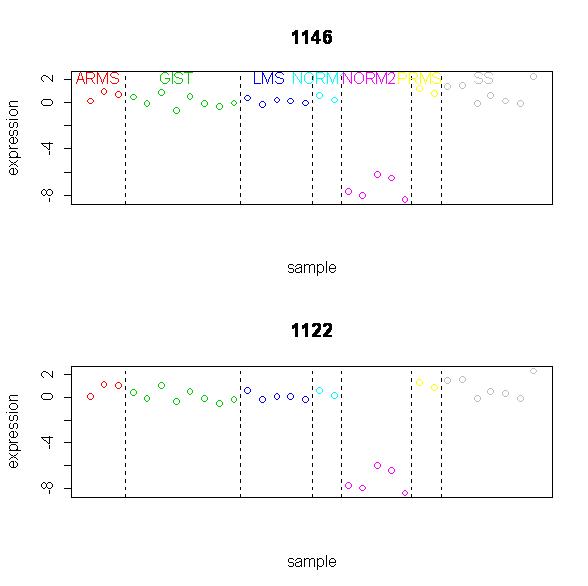
Note that the expression levels is virtually the same for all of the tumor and
tissue types, except for NORM2. This draws attention to the fact that
"significant" does not necessarily mean significant in a way that is
biologically significant, because we have no interest in differentiating smooth
muscle samples from tumors, but rather differentiating tumors from one another.