|
HOME | DESIGN | MICROARRAY SAMPLES | NORMALIZATION | SIGNIFICANCE TESTING | SAM | H. CLUSTERING | PAM CLUSTERING | PAM CLASSIFICATION | CONCLUSIONS |

This web page was produced as an assignment for a course on Statistical
Analysis of Microarray Data at
Initial Significance Testing:
Data from the two "normal" tissue sample types (skeletal (NORM1) and
smooth (NORM2) muscle) were compared to data from the synovial
sarcoma samples (SS).
NORM1-SS Comparison:
Below are the spots that correlate to the top ten significant miRNAs from the NORM1-SS comparison, as well as their
associated p-values (H0: miRNA expression does not
differ between the groups). The miRNAs are not
further annotated since they are not genes.
|
miRNA spot number |
miRNA name |
p-value |
reject H0 at 0.05 sig. level? |
reject H0 with Bonferroni-adjusted alpha = 3.2e-05? |
|
377 |
hsa_miR_133b |
1.944130e-10 |
Yes |
Yes |
|
1419 |
hsa_miR_133a |
4.528836e-10 |
Yes |
Yes |
|
1395 |
hsa_miR_133a |
6.363466e-10 |
Yes |
Yes |
|
1499 |
hsa_miR_1 |
9.546298e-10 |
Yes |
Yes |
|
1448 |
hsa_miR_422a |
1.230338e-09 |
Yes |
Yes |
|
1137 |
hsa_miR_206 |
1.278166e-09 |
Yes |
Yes |
|
695 |
(blank) |
4.977765e-08 |
Yes |
Yes |
|
1472 |
hsa_miR_422a |
5.279171e-08 |
Yes |
Yes |
|
719 |
(blank) |
7.192580e-08 |
Yes |
Yes |
|
197 |
hsa_miR_214 |
1.106340e-07 |
Yes |
Yes |
For each of the above miRNAs, the null hypothesis is
rejected in both adjusted and non-adjusted tests. Thus, we can conclude that
these miRNAs are differentially expressed between the
Normal Skeletal Muscle samples and the Synovial
Sarcoma tumors.
The Volcano Plot below gives a more visual representation of the significance
testing for miRNAs. The top ten miRNAs
from the table are marked on the graph. Because it plots the log of the fold
change versus the log odds, it also provides more information.
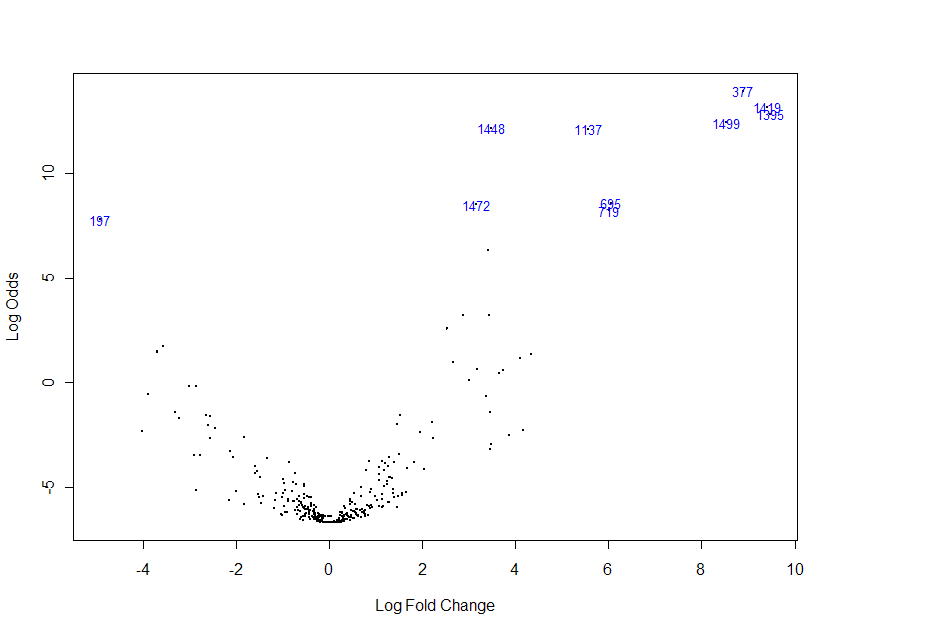
What we are especially interested in are miRNAs that
are highly differentially expressed (high absolute value of Log Fold Change),
but are also statistically significant (High value for Log Odds). Thus, spots
that appear in the upper right and left sides of the "volcano" are
most interesting to us because they are the spots that are both biologically
and statistically significant. The fact that the top ten miRNAs
from our table are also in the best position on the graph is promising!
NORM2-SS Comparison:
Below are the spots that correlate to the top ten significant miRNAs from the NORM2-SS comparison, as well as their
associated p-values (H0: miRNA expression does not
differ between the groups).
|
miRNA spot number |
miRNA name |
p-value |
reject H0 at 0.05 sig. level? |
reject H0 with Bonferroni-adjusted alpha = 3.2e-05? |
|
993 |
hsa_miR_145 |
2.433386e-11 |
Yes |
Yes |
|
969 |
hsa_miR_145 |
3.215736e-11 |
Yes |
Yes |
|
607 |
hsa_miR_143 |
1.009558e-10 |
Yes |
Yes |
|
499 |
ambi_miR_7510 |
1.153537e-10 |
Yes |
Yes |
|
583 |
hsa_miR_143 |
1.287692e-10 |
Yes |
Yes |
|
523 |
ambi_miR_7510 |
3.552259e-10 |
Yes |
Yes |
|
75 |
hsa_miR_29b |
9.751187e-10 |
Yes |
Yes |
|
51 |
hsa_miR_29b |
4.545147e-09 |
Yes |
Yes |
|
1107 |
hsa_miR_194 |
5.633542e-08 |
Yes |
Yes |
|
265 |
hsa_miR_222 |
9.843991e-08 |
Yes |
Yes |
For each of the above miRNAs, the null hypothesis is
rejected. Thus, we can conclude that these miRNAs are
differentially expressed between the Normal Smooth Muscle samples and the Synovial Sarcoma tumors. One interesting thing to note is
that the top ten significant miRNAs differ between
the two comparisons, even though each comparison is the tumor type against a
"control". This is an important observation with regards to the
different types of muscle control.
The Volcano Plot below gives a more visual representation of the significance
testing for miRNAs. The top ten miRNAs
from the table are marked on the graph. Because it plots the log of the fold
change versus the log odds, it also provides more information.
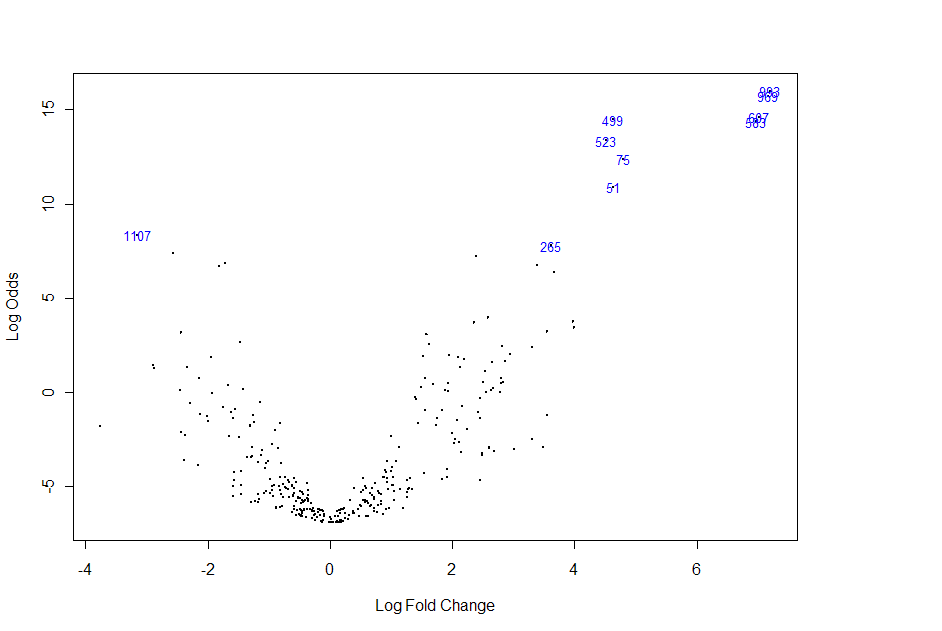
What we are especially interested in are miRNAs that
are highly differentially expressed (high absolute value of Log Fold Change),
but are also significant (High value for Log Odds). Thus, spots that appear in
the upper right and left sides of the "volcano" are most interesting
to us because they are the spots that are both biologically and statistically
significant. The fact that the top ten miRNAs from
our table are also in the best position on the graph is promising!