|
HOME | DESIGN | MICROARRAY SAMPLES | NORMALIZATION | SIGNIFICANCE TESTING | SAM | H. CLUSTERING | PAM CLUSTERING | PAM CLASSIFICATION | CONCLUSIONS |

This web page was produced as an assignment for a course on Statistical
Analysis of Microarray Data at
Significance Analysis of Microarrays (SAM) testing:
Three SAM tests were performed to assess significant miRNAs for the various
tissue samples.
Comparison between all groups:
The first SAM test performed was comparing each of the groups individually. For
this procedure, the ERMS sample and DDLPS sample were removed because SAM
requires at least two arrays to perform testing.
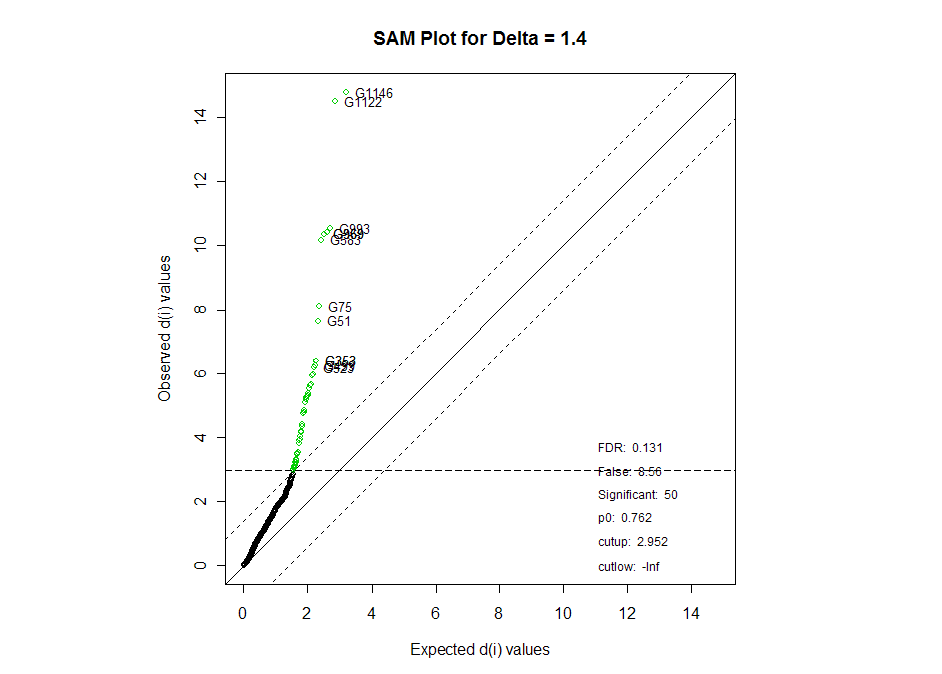
Below is a list of the most significant miRNAs from the SAM comparison. H0 is
that the miRNAs are not differentially expressed between all of the tissue
samples.
|
miRNA spot number |
miRNA name |
q-value |
reject H0 at alpha=0.05 level? |
reject H0 with Bonferroni-adjusted alpha = 3.2e-05? |
|
1146 |
hsa_miR_122a |
0 |
Yes |
Yes |
|
1122 |
hsa_miR_122a |
0 |
Yes |
Yes |
|
993 |
hsa_miR_145 |
0.001 |
Yes |
No |
|
969 |
hsa_miR_145 |
0.001 |
Yes |
No |
|
583 |
hsa_miR_143 |
0.001 |
Yes |
No |
|
75 |
hsa_miR_29b |
0.003 |
Yes |
No |
|
51 |
hsa_miR_29b |
0.004 |
Yes |
No |
|
353 |
hsa_miR_133b |
0.006 |
Yes |
No |
|
523 |
ambi_miR_7510 |
0.006 |
Yes |
No |
|
353 |
hsa_miR_133b |
0.006 |
Yes |
No |
|
499 |
ambi_miR_7510 |
0.006 |
Yes |
No |
Although the q-value is not completely the same as a p-value, it can be
interpreted very similarly. The q-value for each miRNA represents the expected
proportion of false positives incurred when calling that miRNA significant.
Thus, because we don't want a false-positive rate higher than 0.05 (standard),
we would not reject H0 for any miRNA with a q-value greater than 0.05. For each
of the miRNAs above, however, the q-value is much less than 0.05, so H0 is
rejected. Thus, we can conclude that these miRNAs are expressed differentially
expressed between all of the tissue samples. However, when using the
Bonferroni-adjusted cut-off value, we can only conclude that one miRNA (two
tests) is significant.
The plot below shows a more visual representation of the SAM results. The
significant genes are in green, and the genes we represented on the table are
highlighted.
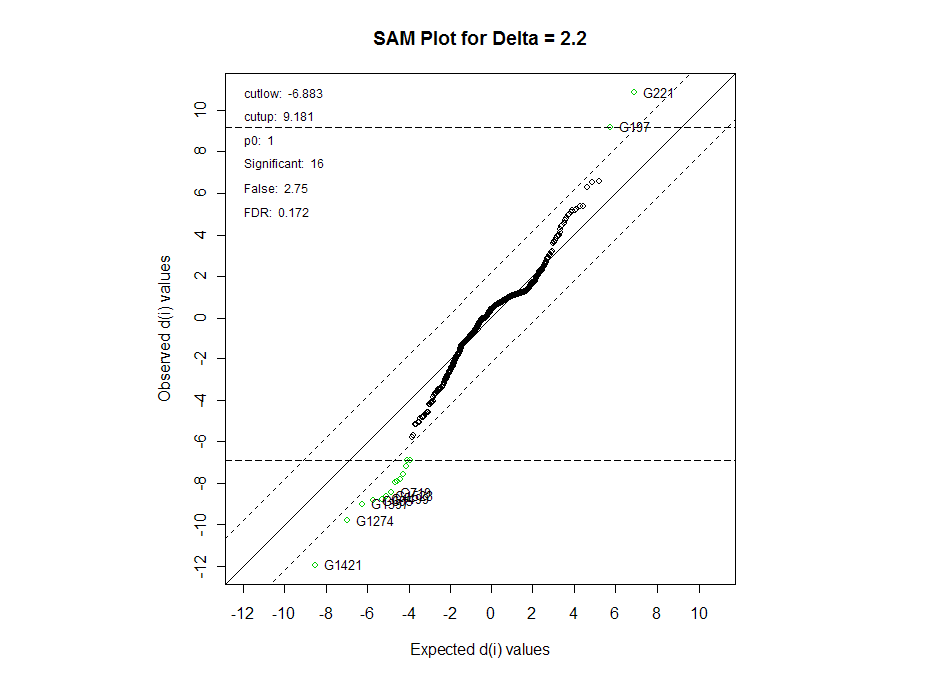
Comparison between NORM1 and SS:
For the second test, I looked at the NORM1 samples and SS samples (the same
ones compared with limma here.
Below is a list of the most significant miRNAs from the SAM comparison.
|
miRNA spot number |
miRNA name |
q-value |
reject H0 at alpha=0.05 level? |
reject H0 with Bonferroni-adjusted alpha = 3.2e-05? |
|
197 |
hsa_miR_214 |
0.176 |
No |
No |
|
221 |
hsa_miR_214 |
0.176 |
No |
No |
|
1421 |
hsa_miR_422b |
0.176 |
No |
No |
|
1274 |
hsa_miR_378 |
0.176 |
No |
No |
|
1397 |
hsa_miR_422b |
0.176 |
No |
No |
|
695 |
(blank) |
0.176 |
No |
No |
|
1499 |
hsa_miR_1 |
0.176 |
No |
No |
|
1523 |
hsa_miR_1 |
0.176 |
No |
No |
|
719 |
(blank) |
0.176 |
No |
No |
Here we do not reject H0 for any of the miRNAs with both the adjusted and
un-adjusted cut-off levels, so we conclude that we do not have enough evidence
to suggest that any of these miRNAs are expressed differently between the NORM1
tissues and SS tumors.
The plot below shows a more visual representation of the SAM results. The
significant genes are in green, and the genes we represented on the table are
highlighted.
Comparison of limma and SAM results:
The miRNAs identified using limma and using SAM are somewhat different. The
common miRNAs to both lists are:
hsa_miR_1
spot 695
spot 719 (probably the same as 695)
hsa_miR_214
The high-ish level of miRNAs that are common to both shows that even though the
SAM results are not "significant," the most significant genes are
still consistent.
I am inclined to trust the SAM results slightly more than the limma results,
mostly because SAM is a non-parametric method, so it seems like it would be
more robust. I also think controlling FDR is important because the FDR is the
most biologically appropriate thing to be controlling. We don't need
"perfect" results (that is, we can tolerate some false-positives),
but we do want to control how "extreme" our results are. If they
cause a high FDR, then we probably aren't interested in these miRNAs
biologically.
I also chose to use the Bonferroni adjustment for multiple comparisons, in
large part because I find this test to be most intuitively satisfying and also
slightly conservative.