|
HOME | DESIGN | MICROARRAY SAMPLES | NORMALIZATION | SIGNIFICANCE TESTING | SAM | H. CLUSTERING | PAM CLUSTERING | PAM CLASSIFICATION | CONCLUSIONS |

This web page was produced as an assignment for a course on Statistical
Analysis of Microarray Data at
Conclusions:
The analysis shows that miRNAs have tremendous
potential in the diagnosis of tumors. miRNAs also could play a big role in exploratory
research into tumor biology, with the potential to answer interesting questions
about the differences between tumors that have been classified as the same
based on the site of diagnosis.
Diagnostic has potential in conjunction with both significance testing and with
classification. Significance testing can help us pin-point a few key miRNAs associated with certain tumor types. This, in
turn, could lead to a quick diagnostic procedure of isolating tumor miRNAs and identifying the levels of these key miRNAs. Classification, on the other hand, would
require the creation of a microarray for each tumor that needs to be diagnosed.
For example, after a well-established library of known tumors and their miRNA profiles is established, doctors could classify their
unknown tumor microarrays against the library for diagnostic purposes.
Though more time-consuming, this would provide a more complete diagnostic
procedure because it would not rely on the use of only a handful of miRNAs.
Significance Testing:
The significance testing, presented here both with t-tests as well as with SAM,
has the most potential for identifying miRNAs that
are associated with certain tumor types. For example, for the comparison
between normal skeletal muscle and synovial sarcoma, miRNA 214 was found to be significant in both t-test and
SAM testing. It is spot 197 on the volcano plot below:
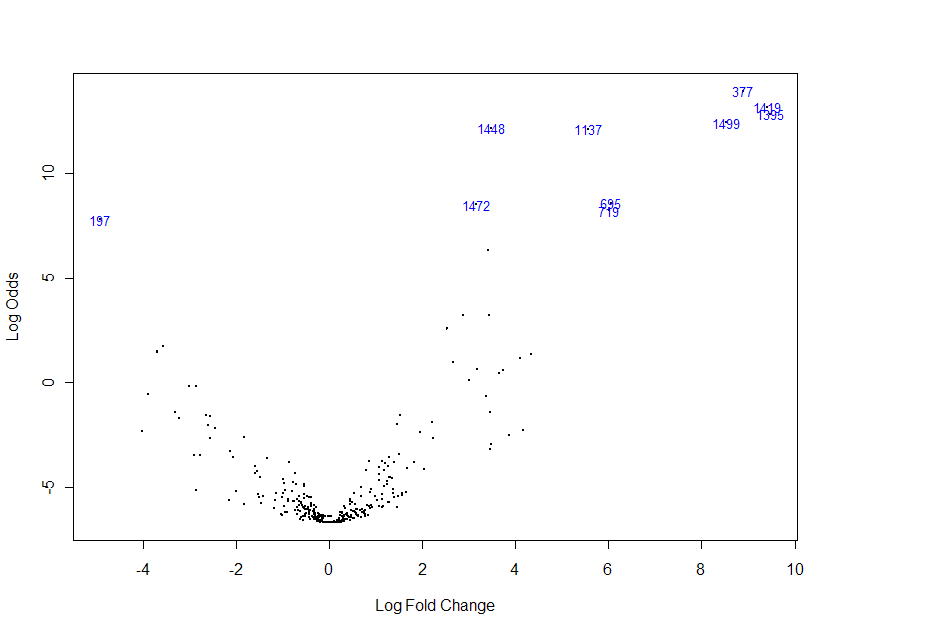
This shows significant down-regulation.
Furthermore, miRNA 214 was found to be highly
significant using SAM procedures. On the SAM plot below, miRNA 214 is represented by spots G221 and G197.
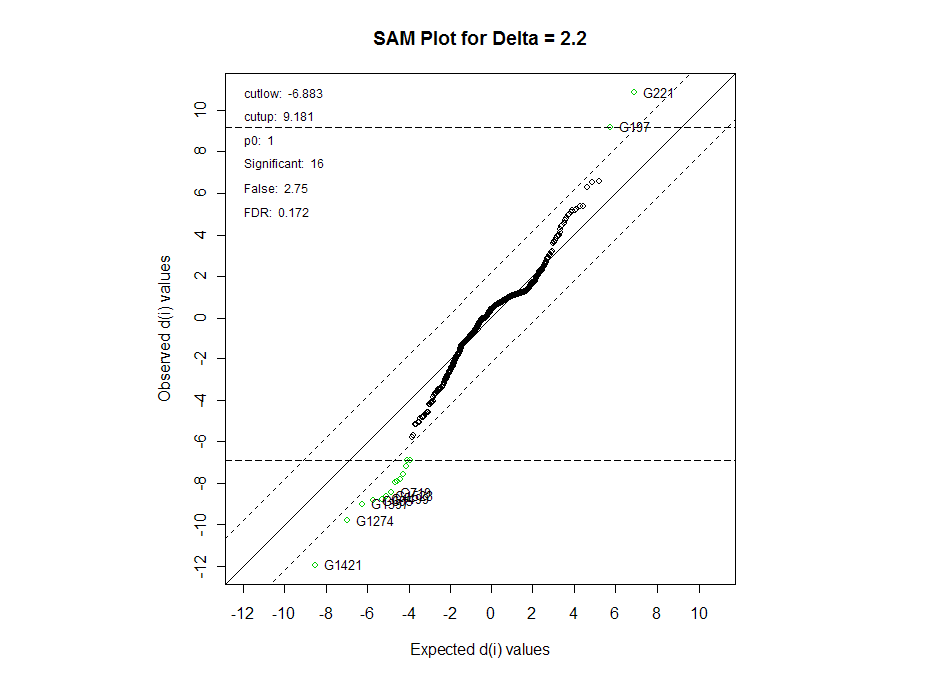
This miRNA was also explored by the authors as one of
the potential significant miRNAs between SS and the
rest of the tumor population.
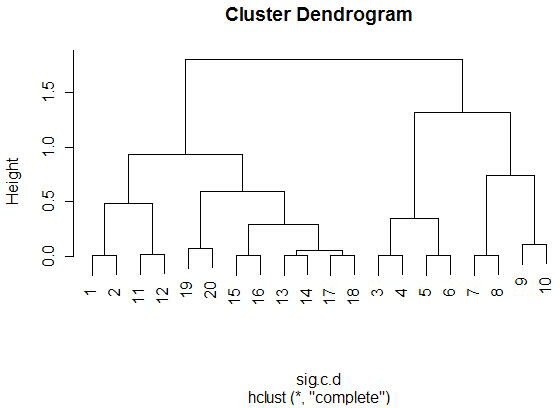
Another exciting result with respect to this specific miRNA
is that is consistently clustered with other miRNAs
that were determined to be significant using testing. The
hierarchical tree shown below shows miRNA 214 (#9 and
#10) clustering with several other genes using complete linkage and
1-correlation distance metric. Because we have confidence that miRNA 214 is signinficant, it
would be very interesting to explore these other miRNAs
to see what relationship they have to synovial
sarcoma.
Classification:
Classification has a huge amount of potential for diagnosis testing.
It is a method that can most fully test the miRNA
expression profile of a tumor and compare that against other, known tumor
expression profiles.
Our PAM Classification results showed much promise. Considering the low
number of arrays for 7 tissue types, we were still able to get our
misclassification error rate down to 26%. The confusion table below
summarizes where our errors were:
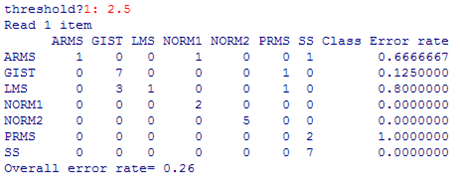
Happily, four of the 7 tissue types were almost always classified correctly.
The others, however, were never or rarely classified correclty
(ARMS, LMS, PRMS).
It remains to be seen whether the misclassification error rate is due to
technical limitations (not enough miRNAs known, poor
quality microarrays, etc.) or biological limiations (miRNA expression is simply not unique enough to tumor
types). This is a vital question that needs to be answered before this
technique can be used on a large scale for diagnostic purposes. However,
it is very clear from this research that miRNAs have
huge potential for classification.